
Most businesses have invested in AI. Very few have redesigned how work actually happens.
Those are two different projects, and the gap between them is where most AI initiatives quietly stall. The AI-native Business Operating System Scorecard exists to measure that gap directly. Not how many tools a team has adopted, but whether the underlying operating model, decision rights, process design, data flow, coordination, and measurement, has actually changed enough to let those tools compound. This piece documents the research behind that decision: why we built the Scorecard around nine specific capabilities instead of the usage metrics most AI maturity tools default to, and what the research foundations underneath each pillar actually say.
Search for "AI maturity assessment" and most of what comes back measures the same handful of things: how many AI tools are licensed, what percentage of employees have logged into one this month, how much AI training staff have completed, how many pilots are currently running. Gartner's own five-stage model, Awareness, Active, Operational, Systemic, Transformational, is one of the more rigorous versions of this, and even it is built primarily around the scope and scale of AI usage rather than whether the business underneath that usage has changed shape.
The problem isn't that these are bad questions. It's that they measure inputs, not the structural conditions that determine whether those inputs turn into outcomes. A team can have licenses for four AI tools, a 90% weekly login rate, and a completed training program, and still route every decision through one overloaded founder, still have no documented process for its core delivery work, and still have no way to tell whether AI changed anything at all. Adoption rate is not the same question as operating model maturity, and treating them as interchangeable is exactly why the large majority of AI pilots never make it past the pilot stage.
The right column is where MIT CISR's longitudinal research on enterprise AI maturity locates the actual payoff. Its four-stage model tracks financial performance alongside AI maturity across a broad sample of enterprises, and the biggest jump in performance doesn't happen between "no AI" and "some AI." It happens between stage two, where companies build pilots and internal capability, and stage three, where they redesign how the work itself gets done at scale. Stage two is the one AI usage metrics reward. Stage three is the one that actually shows up in the numbers. The Scorecard is built to tell a business which side of that line it's actually on.
The nine pillars are grounded in an established, independently documented body of research, applied to the specific reality of small and mid-sized teams rather than the enterprise context most of it was originally written for.
Systems thinking supplies the underlying premise: that how work actually gets done is a property of structure, decision rights, and information flow, not of individual effort or tool access. A team performs only as effectively as its structure allows it to perform. That premise cuts across nearly every pillar below, but it shows up most directly in Decision Authority and Process Clarity, since both measure whether the structure itself keeps output consistent.
Lean operations and business process management contribute the discipline of value stream mapping, originally built for manufacturing floors and adapted for knowledge and administrative work by practitioners including Karen Martin, plus Mike Rother's Toyota Kata, also featured in the Lean Start-up methodology, which reframes continuous improvement as a repeatable daily habit rather than a one-time project. Both inform how the Scorecard evaluates process clarity and output measurement.
Team Topologies, the organizational design approach developed by Matthew Skelton and Manuel Pais, contributes the idea of cognitive load as a team design constraint: coordination isn't free, every additional handoff and status meeting draws down a finite budget of attention, and team structure should be built around minimizing that drag rather than adding more communication on top of it. This directly shapes the coordination efficiency pillar which becomes much more critical now considering the introduction of AI handoff and human-AI collaboration approaches.
AI transformation research spans several parallel bodies of work: McKinsey's Rewired, built from engagements with more than 200 large-scale companies, on the operating capabilities that separate AI leaders from laggards; BCG's 10-20-70 rule on where AI value actually originates; and the Gartner and MIT CISR maturity models referenced above. None of these were written with a 12-person business in mind, which is precisely why translating them into a fast, plain-language diagnostic was necessary rather than optional. This body of work feeds the AI Adoption, AI Integration, and Strategic Direction pillars most directly, and the next section walks through exactly how.
Organizational design and decision-rights research shapes the decision authority pillar directly: how clearly ownership is assigned, and how much of the business depends on any single person being available, is one of the oldest and most consistently replicated predictors of whether an organization can scale its output without scaling its headcount at the same rate.
Product operating models, in particular Basecamp's Shape Up methodology by Ryan Singer, contribute the idea of fixed appetite and visible progress through hill charts rather than open-ended backlogs. That thinking informs how the Scorecard treats output measurement: not whether a business has metrics in a dashboard somewhere, but whether it can see where work is stuck before it becomes a crisis.
High-performance team research, including the widely studied Spotify model of autonomous squads aligned around a shared mission, informs how the team capability pillar treats standardization:. This is much more than having a couple of individuals permitted to experiment with AI, a business needs to convert individual experimentation into a shared, repeatable standard.
Every pillar maps to a specific, researched failure mode rather than a generic "best practice." Each is scored using three or four plain-language answer options rather than open text or a 1-10 scale, because, as with any diagnostic meant to be taken by pressed for time business leader, a question that takes 30 seconds to interpret doesn't get answered.
Every answer option represents a maturity stage of the operating pattern, rather than AI enthusiasm. This makes the resulting score diagnostic instead of a popularity contest for whoever uses the most tools. A business can score low on AI Adoption and still be in a strong position if Decision Authority and Process Clarity are solid, because that's a business that will absorb AI cleanly once it starts. A business with high AI Adoption and weak Process Clarity is often in a worse position than it looks, because it's now running an undocumented, ad-hoc process faster.
The table above summarizes what each pillar measures. What it doesn't show is where that measurement came from. Each pillar was built against a specific, named line of research rather than a general impression of what "good" looks like, and the connection is direct enough to trace question by question.
This pillar draws on decades of decision-rights research, but the sharpest justification for it is mathematical. Brooks's Law, first documented by Fred Brooks in his 1975 book The Mythical Man-Month, observes that communication overhead grows roughly with the square of team size, since every new person adds a new channel to every existing person. A business where every decision routes through one founder has done much more than centralized authority, it has also created a communication bottleneck that gets structurally worse as headcount grows, not better. The pillar's sharpest question, whether delivery would survive leadership disappearing for a week, is a direct proxy for how much of that load has actually been distributed versus stacked onto one person.
BCG's research is what separates this pillar from a simple usage tracker. If only 10% of AI value comes from the algorithm and 70% comes from people and process, then a login count is measuring the smallest part of the equation. That's why the pillar's questions ask about consistency across the team and what would happen if the tools disappeared. A business where three people use AI constantly and the rest have never opened it scores low here for a specific, researched reason: individual enthusiasm doesn't compound the way standardized practice does.
A 2026 Harvard Business School field experiment across 515 high-growth startups, led by Hyunjin Kim, Dahyeon Kim, and Rembrand Koning, gave every firm identical AI resources and varied only one thing: whether founders were shown how other companies had reorganized entire workflows around AI versus simply speeding up existing tasks with it. The treated group found 44% more AI use cases and generated 1.9x higher revenue. Access to AI was never the constraint. Knowing where in the production process to redesign around it was. That's precisely the distinction the AI Integration pillar tests: whether a workflow has been rebuilt around AI, or AI has just been added on top of a process that was never touched.
Value stream mapping, the Lean practice of tracing a piece of work step by step to see where it actually gets stuck, was built for manufacturing floors and has since been adapted for knowledge and administrative work. Mike Rother's Toyota Kata adds the other half of the picture: documentation only stays accurate if improving it is a habit, instead of a one-time project that decays the moment nobody's looking. The pillar's question about whether a new hire could follow a core workflow without asking questions is a blunt but effective test of both: is the process actually written down, and has it been kept current.
Team Topologies' cognitive load framework and Brooks's Law reinforce each other here. Team Topologies argues that every extra handoff and status meeting draws down a finite budget of attention; Brooks's Law explains why that budget shrinks so quickly as a team grows, since communication channels multiply faster than headcount does. A single trusted source of project status doesn't just feel tidier. It collapses the number of channels people actually need to check, which is the direct lever both bodies of research point to for reducing coordination drag.
MIT CISR's four-stage research treats connected, exportable data as a prerequisite for the stage-three jump. Considering it a nice to have can cause serious challenges to any AI implementation. Enterprises stuck in stage one and two are disproportionately the ones still compiling reports by hand from disconnected systems. The pillar's question about whether operational data lives in one connected system or is scattered across tools is asking, in plain language, whether a business has cleared the prerequisite MIT CISR's data identifies before the bigger AI investments start paying off.
A 2025 AI literacy development framework published in Business Horizons makes the case that literacy is a combination of skills with meaningfully different requirements for frontline staff, managers, and executives. Treating AI literacy as uniform across a team, the way a single training completion rate does, misses that a salesperson and a founder need to know different things about the same tool. The pillar's question about whether the team has role-specific guidance, rather than a single generic policy, is built directly on that distinction.
Basecamp's Shape Up hill charts give visibility into where work actually sits before it becomes a crisis. John Doerr's OKR methodology, documented in Measure What Matters, contributes the other half: that a metric is only useful if it is compared against a baseline, and not a number to admire in isolation. The pillar's question about whether AI-driven changes have been evaluated against a before-and-after baseline pulls directly from that principle. Without a baseline, "AI helped" is a feeling. With one, it's a number that can be checked.
The NIST AI Risk Management Framework structures its guidance around four functions, and deliberately puts Govern first: the organizational foundation of policy and leadership alignment that has to exist before the other three functions can work. Gartner's Transformational stage and McKinsey's Rewired make the same point from a business-strategy angle: leadership either has a structured view of where AI changes the model, or it doesn't, and that view has to exist before tactical AI decisions can be made consistently. The pillar's question about whether leadership has had a structured conversation on this in the last 12 months is asking whether that Govern-equivalent foundation is actually in place.
The nine pillar scores roll up into one of five operating levels. These aren't pass or fail categories. The operating levels describe how consistently a business behaves the same way twice, and how much of that behavior currently runs through people rather than structure.
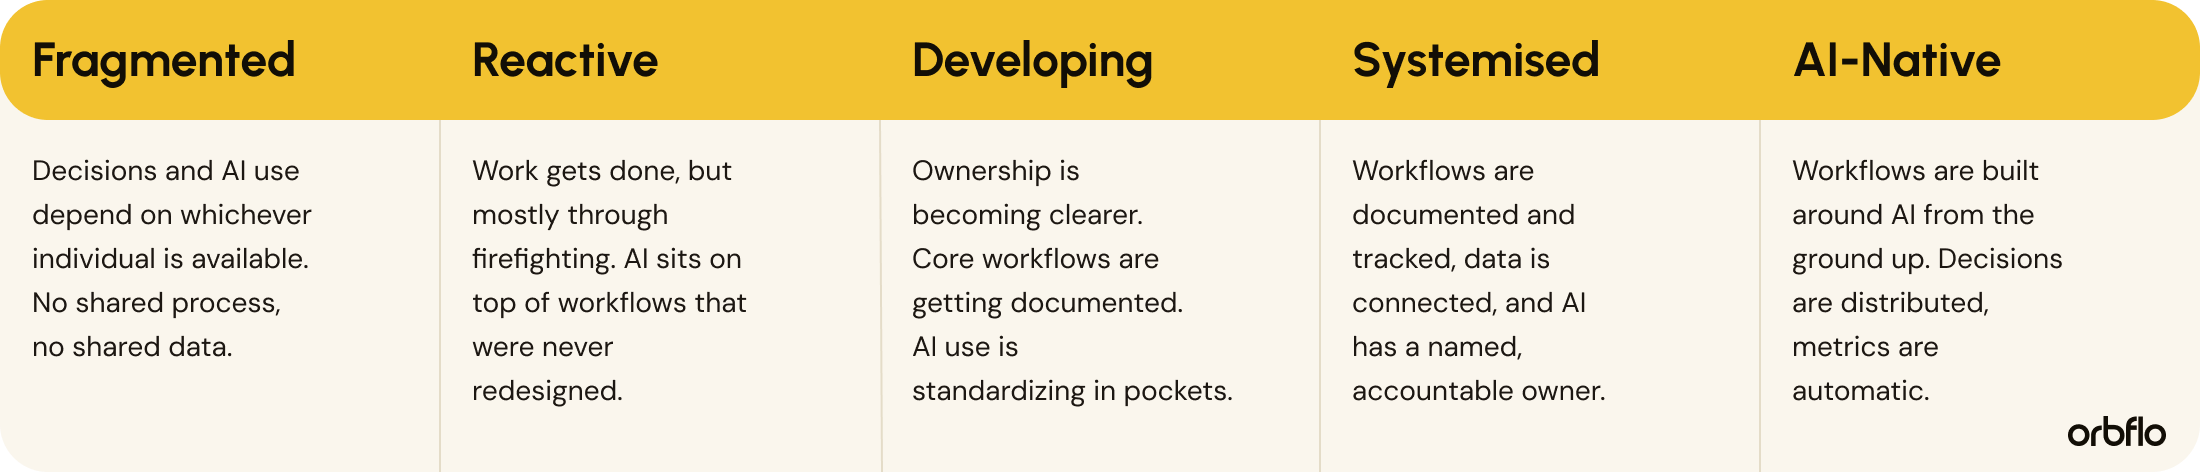
Most small and mid-sized businesses that take the Scorecard land somewhere between Reactive and Developing: good output and revenue, but a structure that depends heavily on a small number of people holding the details in their heads. That's the normal state for a business that grew by hiring and hustle rather than by design. It's also exactly the gap the Scorecard is built to make visible, because a business can't redesign a structure it can't see.
Completing the assessment produces four things, not just a number. An overall operating score, benchmarked against the five levels above. Nine individual capability scores, one per pillar, so it's clear which specific area is holding the rest back rather than a single blended figure that hides it. And an invitation to a working session where those insights turn into an actual plan, the same shift from diagnosis to workflow redesign that the research above consistently points to as the actual point where value gets created.
Where to start
The AI Operating System Scorecard scores these nine capabilities in under ten minutes and shows exactly where a business sits on the path from Fragmented to AI-Native.
Both. The nine pillars and the five-level scoring model are Orbflo's own synthesis, but each pillar is grounded in an established, independently published body of research rather than invented from scratch, including work from MIT CISR, BCG, Gartner, Team Topologies, and Lean/BPM practice. The sources section below links to the original material for anyone who wants to check the foundations directly.
Under 10 minutes. Every question was standardized to three or four plain-language answer options specifically so it could be answered in a couple of seconds without needing a spreadsheet, a percentage estimate, or a meeting to agree on the answer first.
Most AI maturity assessments, including well-regarded ones like Gartner's, measure how much AI a business is using which can also be seen as a vanity metric. The Scorecard measures whether the business underneath that AI use, its decision rights, process documentation, data connectivity, and coordination, has actually changed enough to make that usage stick. A business can score high on tool adoption and low on the Scorecard, and that gap is usually the more useful thing to know and act upon.





The AI Operating System Scorecard is a diagnostic tool that measures whether your business is structurally built to make AI compound, across nine dimensions including how decisions get made, how clearly your processes are defined and how your team is using and integrating AI.
The output is a clear view of where your biggest leverage gaps are and where to focus first.


One practical AI operating-system insight bi-weekly.
No fluff, no spam.

© 2026 AV Ventures Limited trading as Orbflo | All Rights Reserved